Mastering Automation Debugging and Observability in Home Assistant: Leveraging Traces and Logs for Reliability

NGC 224
DIY Smart Home Creator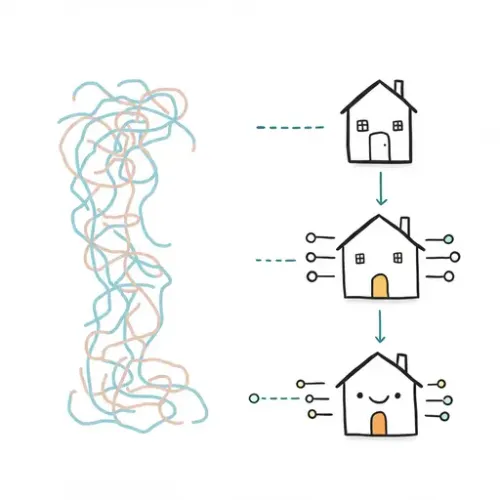
The Unsung Hero of Smart Homes: Debugging
As Home Assistant users, we revel in the power of automation – lights turning on at sunset, doors locking when we leave, and climate control adapting to our presence. But what happens when an automation mysteriously fails to trigger, or behaves erratically? A seemingly minor glitch can quickly erode confidence in your smart home. This is where mastering debugging and observability becomes not just useful, but essential for a reliable and enjoyable smart home experience.
While many focus on building new automations, understanding why existing ones fail is equally, if not more, important. Home Assistant provides powerful, often underutilized, built-in tools to diagnose and troubleshoot these issues. In this guide, we'll explore how to leverage automation traces, system logs, and developer tools to pinpoint problems, improve your automation logic, and build a truly resilient smart home.
The Home Assistant Debugging Toolkit
Home Assistant offers several integrated features designed to help you understand and debug your automations and the system as a whole:
1. Automation Traces: Your Automation's Execution History
Introduced in recent versions, automation traces are perhaps the most powerful tool for debugging specific automations. Every time an automation runs (or attempts to run), Home Assistant captures a detailed trace of its execution path. This includes:
- Trigger Information: What specifically caused the automation to attempt to run.
- Condition Evaluation: Whether each condition passed or failed, and why.
- Action Execution: Which actions were called, their parameters, and any errors encountered.
- Timing: When each step occurred.
- Variables: The state of any variables defined or used within the automation.
Accessing and Interpreting Traces:
- Navigate to Settings -> Automations & Scenes -> Automations.
- Select the automation you want to debug.
- In the top right corner of the automation editor, you'll see an icon that looks like a small flow chart or a circle with a dot (often labeled Trace or Show trace). Click it.
- The trace viewer will open, displaying a list of recent executions. Select the relevant trace.
- The trace viewer provides a visual representation of the automation's flow. You can step through each stage (trigger, conditions, actions) and see exactly where it succeeded or failed. Pay close attention to red lines or exclamation marks, which indicate failures or skipped steps. Hovering over steps often reveals detailed information or error messages.
2. Home Assistant Logs: The System's Diary
The home-assistant.log file is the central repository for all system messages, errors, warnings, and debugging information. While less specific to a single automation, it's invaluable for broader issues, integration problems, or when traces don't provide enough detail.
Accessing and Configuring Logs:
- Via UI: Go to Settings -> System -> Logs. This provides a live view of recent log entries.
- Direct File Access: For advanced users, the log file is typically located in your Home Assistant configuration directory (e.g.,
/config/home-assistant.log). You can access it via Samba Share, SSH, or the File Editor add-on. - Setting Log Levels: By default, Home Assistant logs at the
INFOlevel. For deeper debugging, you can temporarily increase the log level for specific components in yourconfiguration.yaml:
logger:
  default: warning
  logs:
    homeassistant.components.automation: debug
    homeassistant.components.zwave_js: debug # Example for a specific integration
    custom_components.my_custom_integration: debug # Example for a custom integration
Remember to restart Home Assistant after changing log levels. Revert to info or warning for daily operation to prevent excessive log file growth.
3. Developer Tools: Your Interactive Sandbox
Located in the left sidebar, the Developer Tools are critical for testing and understanding your Home Assistant setup in real-time.
- States: View the current state of any entity, including its attributes. Essential for checking if sensors are reporting correctly or if a switch is in the expected state.
- Services: Manually call any service (e.g., turn on a light, send a notification, set an input boolean). This is invaluable for testing individual actions of an automation without needing to trigger the whole automation.
- Templates: Test Jinja2 templates directly. If your automation relies on complex templating for conditions or actions, this is where you can refine and debug the template logic.
Step-by-Step Debugging Workflow
When an automation misbehaves, follow this systematic approach:
Step 1: Identify the Symptom
- Is the automation not triggering at all?
- Is it triggering at the wrong time or too often?
- Is it triggering, but the actions aren't executing correctly?
- Are there unexpected errors or warnings in the UI or logs?
Step 2: Check Automation Traces (First Stop!)
For automation-specific issues, traces are your best friend.
- Locate the automation and open its trace viewer.
- Look for the most recent trace corresponding to the problematic event.
- Visually follow the flow:
- Did the trigger fire as expected? The trace will show the specific event or state change that initiated the trace.
- Did all conditions pass? A red 'x' indicates a failed condition. Click on it to see why it failed (e.g., 'template rendered to false', 'state did not match').
- Did all actions execute? Check for errors during action execution. Often, these relate to invalid service calls or incorrect entity IDs.
- Use the trace debugger's slider to step through the execution and observe entity states at each point.
Step 3: Dive into Logs for Deeper Insights
If traces are inconclusive, or if the problem seems broader than a single automation, check the logs:
- Go to Settings -> System -> Logs.
- Filter by keywords related to your automation, entities, or integration (e.g.,
automation,light.kitchen,mqtt). - Temporarily increase log levels for relevant components (as described above) if you need more verbose output, then reproduce the issue.
- Look for
ERRORorWARNINGmessages. These often directly point to the root cause of a problem, such as malformed YAML, connection issues, or unhandled exceptions.
Step 4: Isolate and Test with Developer Tools
Once you have a hypothesis from traces/logs, use Developer Tools to confirm:
- States: If a condition failed due to an unexpected entity state, go to Developer Tools -> States and verify the current state of that entity. Does it match what your automation expects?
- Services: If an action failed, try calling that specific service manually from Developer Tools -> Services. Does it work? Are the parameters correct? This helps isolate if the issue is with the service call itself or with how the automation is passing data to it.
- Templates: Copy the problematic Jinja2 template (from a condition or action) into Developer Tools -> Templates. Use real entity states to test its output. This is crucial for complex conditional logic.
Step 5: Refine and Test Again
Based on your findings, modify the automation. Make small, incremental changes and test after each. If you're making significant changes, consider using Home Assistant Packages or a separate test automation to avoid breaking your main setup.
Best Practices for Robust Automations
Prevention is better than cure. Adopt these practices to minimize debugging headaches:
- Clear Naming Conventions: Give automations, entities, and variables descriptive, unambiguous names.
- Add Comments: Explain complex logic or unusual design choices within your YAML automations.
- Break Down Complexity: Instead of one giant automation, break complex workflows into smaller, more manageable automations, or use Scripts for reusable action blocks.
- Defensive Templating: Use default values in Jinja2 templates (e.g.,
{{ state_attr('light.bedroom', 'brightness') | default(0) }}) to prevent errors if an entity or attribute is unexpectedly unavailable. - Choose Triggers Carefully: Understand the difference between state, event, and numeric state triggers. Use the most appropriate one for your scenario.
- Test Edge Cases: Don't just test the ideal scenario. What happens if a device is offline? What if a sensor reports an unexpected value?
- Version Control: For power users, placing your Home Assistant configuration under Git version control (e.g., on GitHub or a local Gitea instance) allows you to easily track changes, revert to previous working states, and collaborate.
- Notifications for Critical Failures: Consider setting up automations that notify you if a critical device goes offline or a vital automation fails repeatedly (e.g., by checking a helper entity updated by the automation).
Conclusion
Debugging isn't just about fixing what's broken; it's about understanding how your smart home truly operates. By actively using Home Assistant's built-in automation traces, log viewer, and developer tools, you gain unparalleled insight into your system's behavior. This knowledge empowers you to not only fix current issues but also design more robust, reliable, and intelligent automations, ensuring your smart home consistently delivers on its promise.
Embrace the debugger. It's the key to unlocking the full potential and dependability of your Home Assistant ecosystem.
NGC 224
Author bio: DIY Smart Home Creator
