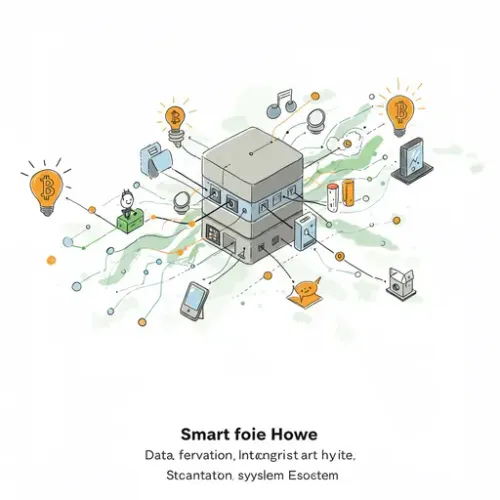
Mastering Advanced Data Visualization: Integrating Grafana with Home Assistant

NGC 224
DIY Smart Home Creator
Your Home Assistant setup generates a wealth of data: temperature, humidity, energy consumption, and countless other metrics. While HA's built-in history and Lovelace graphs are useful, they often lack the depth for advanced analysis, custom aggregations, or professional-grade dashboards. This is where Grafana shines.
Grafana is an open-source analytics and visualization web application. Integrating it with your Home Assistant database unlocks powerful insights, enabling dynamic dashboards to track long-term trends, compare device performance, and optimize your smart home.
Why Grafana for Home Assistant?
- Advanced Visualization: Explore various graph types: gauges, heatmaps, bar charts, etc.
- Customizable Dashboards: Design tailored dashboards with multiple panels and variable filters.
- Long-Term Trend Analysis: Easily analyze data over months or years, revealing hidden patterns.
- Performance Monitoring: Track automation efficiency, network stability, or device energy usage.
- Alerting: Configure sophisticated alerts based on data thresholds.
Prerequisites
Before starting:
- Home Assistant Instance: Running HA.
- External Database for Home Assistant: Grafana needs direct access to HA's data. HA must use MariaDB (MySQL) or PostgreSQL, not default SQLite. Refer to the Home Assistant Recorder documentation for setup.
- Docker: Recommended for easy Grafana deployment.
Step-by-Step Setup
1. Home Assistant Database Configuration
Your configuration.yaml for the recorder integration should resemble this (for MariaDB/MySQL):
recorder:
  db_url: mysql://homeassistant:YOUR_PASSWORD@CORE_IP:3306/homeassistant?charset=utf8mb4
  auto_purge: true
  purge_keep_days: 30
Replace YOUR_PASSWORD and CORE_IP. Ensure the database user has read-only permissions. Restart Home Assistant.
2. Install Grafana with Docker Compose
Create a directory (e.g., /opt/grafana) and a docker-compose.yaml file:
version: '3.8'
services:
  grafana:
    image: grafana/grafana:latest
    container_name: grafana
    ports:
      - "3000:3000"
    volumes:
      - ./data:/var/lib/grafana
      - ./provisioning:/etc/grafana/provisioning
    environment:
      - GF_SECURITY_ADMIN_USER=admin
      - GF_SECURITY_ADMIN_PASSWORD=your_strong_grafana_password
    restart: unless-stopped
Replace your_strong_grafana_password. Run docker compose up -d. Access Grafana at http://your_server_ip:3000 (admin/chosen password).
3. Configure Grafana Data Source
- In Grafana, go to Connections > Data sources > Add new data source.
- Select MySQL or PostgreSQL.
- Fill connection details:
- Name:
Home Assistant DB - Host: Your database server IP:Port (e.g.,
CORE_IP:3306) - Database:
homeassistant - User: Your HA database user
- Password: User's password
- Name:
- Save & test. Confirm "Database Connection OK".
4. Understanding HA's Database Schema
HA stores state changes primarily in the states table:
entity_id: Unique ID (e.g.,sensor.living_room_temperature).state: Entity's value (e.g.,22.5,on).last_changed: When state value *actually changed*.last_updated: When entity was last updated.
5. Creating Your First Dashboard
Visualize a temperature sensor:
- From Grafana sidebar, Dashboards > New Dashboard > Add a new panel.
- Select "Home Assistant DB" as data source.
- Enter SQL (for MySQL):
- In Transform, add "Reduce" and select "Mean" or "Last (not null)" for "state".
- In Visualization, choose "Time series" or "Graph".
- Apply, then Save dashboard.
SELECT
  UNIX_TIMESTAMP(last_updated) AS "time",
  CAST(state AS DECIMAL(10, 2)) AS "value"
FROM states
WHERE
  entity_id = 'sensor.living_room_temperature' AND
  $__timeFilter(last_updated)
ORDER BY last_updated ASC
Replace sensor.living_room_temperature. $__timeFilter adjusts the time range.
Device Integration Tips
- Filtering Data (Recorder): Use
include/excludein HA'srecorderto optimize performance and storage.
recorder:
  db_url: ...
  include:
    domains:
      - sensor
    entity_globs:
      - light.living_room_*
  exclude:
    domains:
      - script
      - automation
CAST(state AS DECIMAL) for numerical data, as HA stores all states as strings.AVG() with Grafana's Group by time ($__interval).Best Practices for a Reliable Smart Home with Grafana
- Data Retention: Use HA's
recorder.purge_keep_days. Consider aggregated tables for very long-term archival. - Database Performance: Ensure indexes on
states.entity_id/last_updated. For large installs, use a dedicated DB server. Write efficient queries. - Security: Create a dedicated, read-only database user for Grafana. Use strong passwords for Grafana admins; secure external access via reverse proxy with SSL/TLS.
- Alerting: Leverage Grafana's engine for critical threshold notifications.
- Backup Dashboards: Export Grafana dashboards as JSON and back up your
grafana/datavolume regularly. - Community Dashboards: Explore Grafana's community dashboards for HA examples.
Conclusion
Integrating Grafana with Home Assistant transforms your smart home data into actionable insights. This powerful combination allows you to understand long-term trends, optimize device performance, and make informed decisions about your home. While it adds complexity, Grafana's analytical depth and flexibility are invaluable for mastering your smart home ecosystem.

NGC 224
Author bio: DIY Smart Home Creator
